Packet Where Are You?
PWRU (Packet Where Are you)
Taken from the their github repo https://github.com/cilium/pwru : “pwru is an eBPF-based tool for tracing network packets in the Linux kernel with advanced filtering capabilities. It allows fine-grained introspection of kernel state to facilitate debugging network connectivity issues.”
So it is a tool that attach a bunch of kprobes to specific kernel functions or interfaces I’m not so sure and it shows places in the kernel data path that a given packet traverses
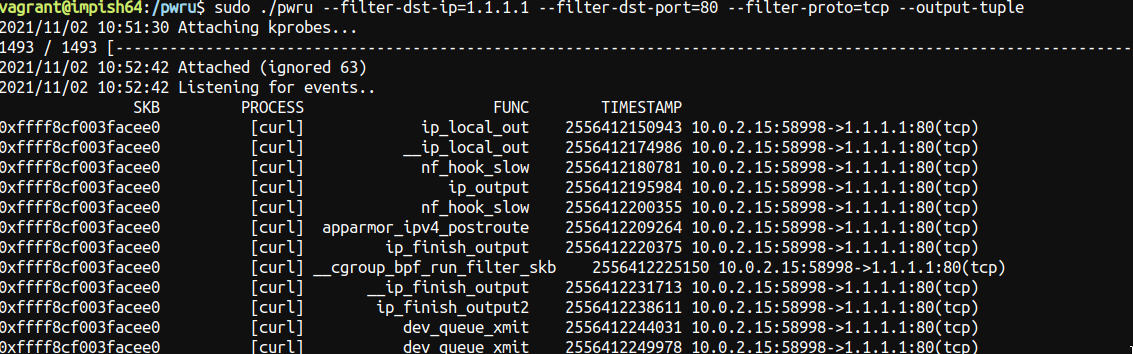
It’s got many output formats but in its basic format
--output-tupple
(l4 tuples shows you something like this):
So you can see SKBs ids process functions and tuples , it is really really interesting to have this level of visibility so easily , the only catch is the kernel and config settings within it that you have to have to use this , sometimes production servers are not running cutting edge kernels therefore these kind of tools are a bit out of reach but never the less this is short of awesome. Read requirements at https://github.com/cilium/pwru#requirements
Lets do a little experiment then!
I’m expanding on what’s on their github a little bit , so we gonna be curling to 1.1.1.1 on OUTPUT but we gonna be dropping the packets with iptables
Not Dropping Traffic
So this is how it looks without dropping , this will be a subset only:
Iptables will always have a hook on traffic so even tho iptables is not gonna drop this packet you can see the hook is called nf_hook_slow
0xffff8cf003facee0 [curl] nf_hook_slow 2556412200355 10.0.2.15:58998->1.1.1.1:80(tcp)
And you can see there’s some apparmor calls after and some queue xmit etc … it looks quite normal.
Dropping Traffic:
So we’re going to drop traffic egressing to 1.1.1.1 the iptables rule could be anything on filter but taking their example it will look like:
iptables -t filter -I OUTPUT 1 -m tcp --proto tcp --dst 1.1.1.1/32 -j DROP
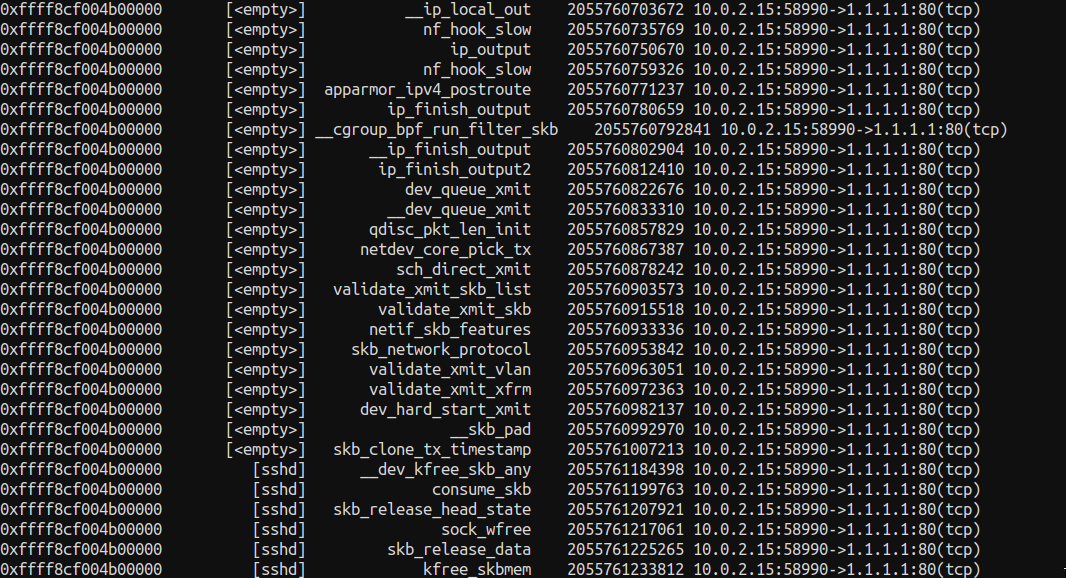
e Now when we curl it look a lot shorter and a lot different:
Look that after nf_hook_slow there’s a kfree_skb right after , also apparmor and queue xmit calls aren’t visible anymore . The number of functions that are called in a successful request are significantly larger than when the packet is drop of course , but its hard to see on an image.
Investigating nf_hook_slow
It seems that nf_hook_slow its not only in charge of the hooks but also DROPS or ACCEPT the packet , look at the code below https://elixir.bootlin.com/linux/latest/source/net/netfilter/core.c#L582
int nf_hook_slow(struct sk_buff *skb, struct nf_hook_state *state,
     const struct nf_hook_entries *e, unsigned int s)
{
  unsigned int verdict;
  int ret;

  for (; s < e->num_hook_entries; s++) {
    verdict = nf_hook_entry_hookfn(&e->hooks[s], skb, state);
    switch (verdict & NF_VERDICT_MASK) {
    case NF_ACCEPT:
      break;
    case NF_DROP:
      kfree_skb(skb);
      ret = NF_DROP_GETERR(verdict);
      if (ret == 0)
        ret = -EPERM;
      return ret;
    case NF_QUEUE:
      ret = nf_queue(skb, state, s, verdict);
      if (ret == 1)
        continue;
      return ret;
    default:
      /* Implicit handling for NF_STOLEN, as well as any other
       * non conventional verdicts.
       */
      return 0;
    }
  }

  return 1;
}
From a total novice view , i can see that if the he verdict (which i assume is the way iptables process its rules) returns drop , the function kfree_skb is called immediately , this free the skb struct memory footprint.
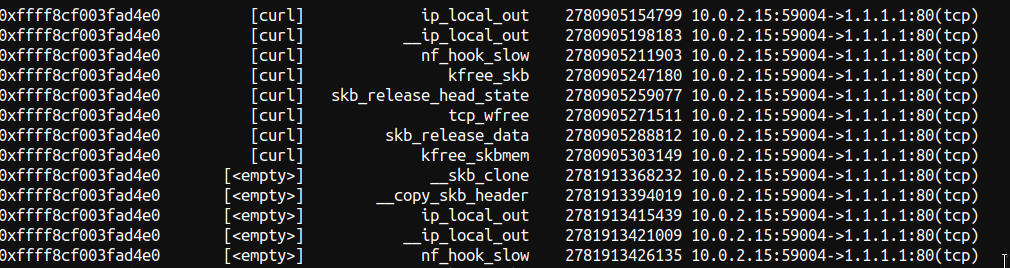
Now you can “easily” see it is iptables dropping the packet:

I say “easily” cause this is not easy at all , wouldn’t it be nice if iptables would call a dedicated function for DROP ? so we would see it in pwru ? Well I hope this helps anybody , I will be using this tool!